python format print example

In [1]:
print 'before: {:.2f} after'.format(1.5555)
before: 1.56 after
In [2]:
print '{1},{0},{1},{2},{0}'.format('pos',777,True) 
777,pos,777,True,pos
In [3]:
print '{name},{age}'.format(age=18,name='cutie')  
cutie,18
In [4]:
has=['first', 2.00, 'third']
print '1st {0[0]} all: {0} last {0[2]} end'.format(has)
1st first all: ['first', 2.0, 'third'] last third end
In [5]:
print 'start--- {:,} ---end'.format(9876543210)
start--- 9,876,543,210 ---end
In [6]:
print 'start:{:>8}'.format(123)
start:     123
In [7]:
print 'start:{:0>8}'.format(123)
start:00000123
In [8]:
print 'start:{:A>8}'.format(123)
start:AAAAA123
In [ ]:
 
In [ ]:
 
In [ ]:
 

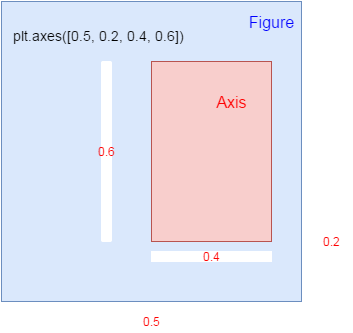
understand axis in matplotlib

axis is a subarea within figure() in matplotlib

figure()

plt.axes([0.3, 0.5, 0.4, 0.2])


the figure area size is 1, 1 as base


In [2]:
import matplotlib.pyplot as plt
import numpy as np
In [6]:
physical_sciences=[ 13.8,  14.9,  14.8,  16.5,  18.2,  19.1,  20. ,  21.3,  22.5,
        23.7,  24.6,  25.7,  27.3,  27.6,  28. ,  27.5,  28.4,  30.4,
        29.7,  31.3,  31.6,  32.6,  32.6,  33.6,  34.8,  35.9,  37.3,
        38.3,  39.7,  40.2,  41. ,  42.2,  41.1,  41.7,  42.1,  41.6,
        40.8,  40.7,  40.7,  40.7,  40.2,  40.1];
computer_science=[ 13.6,  13.6,  14.9,  16.4,  18.9,  19.8,  23.9,  25.7,  28.1,
        30.2,  32.5,  34.8,  36.3,  37.1,  36.8,  35.7,  34.7,  32.4,
        30.8,  29.9,  29.4,  28.7,  28.2,  28.5,  28.5,  27.5,  27.1,
        26.8,  27. ,  28.1,  27.7,  27.6,  27. ,  25.1,  22.2,  20.6,
        18.6,  17.6,  17.8,  18.1,  17.6,  18.2]
year=[1970, 1971, 1972, 1973, 1974, 1975, 1976, 1977, 1978, 1979, 1980,
       1981, 1982, 1983, 1984, 1985, 1986, 1987, 1988, 1989, 1990, 1991,
       1992, 1993, 1994, 1995, 1996, 1997, 1998, 1999, 2000, 2001, 2002,
       2003, 2004, 2005, 2006, 2007, 2008, 2009, 2010, 2011]

two methods to specify many distinct graphs

In [10]:
# Plot in blue the % of degrees awarded to women in the Physical Sciences
plt.plot(year, physical_sciences, color='blue')

# Plot in red the % of degrees awarded to women in Computer Science
plt.plot(year, computer_science, color='red')

# Display the plot
plt.show()
In [8]:
# Create plot axes for the first line plot
plt.axes([0.05,0.05,0.425,0.9])

# Plot in blue the % of degrees awarded to women in the Physical Sciences
plt.plot(year,physical_sciences, color='blue')

# Create plot axes for the second line plot
plt.axes([.525,0.05,0.425,0.9])


# Plot in red the % of degrees awarded to women in Computer Science
plt.plot(year,computer_science, color='red')


# Display the plot
plt.show()
In [9]:
# Create a figure with 1x2 subplot and make the left subplot active
plt.subplot(1,2,1)

# Plot in blue the % of degrees awarded to women in the Physical Sciences
plt.plot(year, physical_sciences, color='blue')
plt.title('Physical Sciences')

# Make the right subplot active in the current 1x2 subplot grid
plt.subplot(1,2,2)


# Plot in red the % of degrees awarded to women in Computer Science
plt.plot(year, computer_science, color='red')
plt.title('Computer Science')

# Use plt.tight_layout() to improve the spacing between subplots
plt.tight_layout()
plt.show()
In [ ]:
 

Jupyter notebook into post

download jupyter notebook as html,

add that html source code to XYZ Html

embed that to post like

In [1]:
import numpy as np

from bokeh.plotting import figure, show, output_file
from bokeh.io import output_notebook

N = 4000
x = np.random.random(size=N) * 100
y = np.random.random(size=N) * 100
radii = np.random.random(size=N) * 1.5
colors = ["#%02x%02x%02x" % (int(r), int(g), 150) for r, g in zip(50+2*x, 30+2*y)]
In [2]:
output_notebook()
Loading BokehJS ...
In [3]:
p = figure()

p.scatter(x, y, radius=radii,
          fill_color=colors, fill_alpha=0.6,
          line_color=None)

# output_file("color_scatter.html", title="color_scatter.py example")

show(p)  # open a browser
In [ ]:
 
In [1]:
import pandas as pd
import matplotlib.pyplot as plt
from time import time

%matplotlib inline
plt.rcParams['figure.figsize'] = (1.5, 1.5) # set default size of plots
# plt.rcParams['image.interpolation'] = 'nearest'
# plt.rcParams['image.cmap'] = 'gray'
In [2]:
from sklearn.decomposition import PCA, RandomizedPCA, randomized_svd
from sklearn.cluster import KMeans
from sklearn.manifold import Isomap
from sklearn.model_selection import train_test_split, KFold
In [3]:
train=pd.read_csv('train.csv')
test=pd.read_csv('test.csv')
train.shape,test.shape
Out[3]:
((42000, 785), (28000, 784))
In [4]:
train.head(1)
Out[4]:
label pixel0 pixel1 pixel2 pixel3 pixel4 pixel5 pixel6 pixel7 pixel8 ... pixel774 pixel775 pixel776 pixel777 pixel778 pixel779 pixel780 pixel781 pixel782 pixel783
0 1 0 0 0 0 0 0 0 0 0 ... 0 0 0 0 0 0 0 0 0 0

1 rows × 785 columns

In [5]:
test.head(1)
Out[5]:
pixel0 pixel1 pixel2 pixel3 pixel4 pixel5 pixel6 pixel7 pixel8 pixel9 ... pixel774 pixel775 pixel776 pixel777 pixel778 pixel779 pixel780 pixel781 pixel782 pixel783
0 0 0 0 0 0 0 0 0 0 0 ... 0 0 0 0 0 0 0 0 0 0

1 rows × 784 columns

In [9]:
label=train.pop('label')
In [7]:
def fuckpca(train,test,n):
    start=time()
    pca=PCA(n_components=n,whiten=True)
    train=pca.fit_transform(train)
    test=pca.transform(test)
    print 'used {:.2f}s'.format(time()-start)
    return train,test
In [8]:
train_pca,test_pca=fuckpca(train,test,36)
used 4.97s
In [9]:
train_pca.shape,test_pca.shape
Out[9]:
((42000L, 36L), (28000L, 36L))
In [10]:
plt.imshow(train_pca[3].reshape(6,-1))
Out[10]:
<matplotlib.image.AxesImage at 0x1b99b358>
In [11]:
from sklearn.ensemble import GradientBoostingClassifier, GradientBoostingRegressor
In [12]:
model=GradientBoostingClassifier(verbose=1,n_estimators=300)
model
Out[12]:
GradientBoostingClassifier(criterion='friedman_mse', init=None,
              learning_rate=0.1, loss='deviance', max_depth=3,
              max_features=None, max_leaf_nodes=None,
              min_impurity_split=1e-07, min_samples_leaf=1,
              min_samples_split=2, min_weight_fraction_leaf=0.0,
              n_estimators=300, presort='auto', random_state=None,
              subsample=1.0, verbose=1, warm_start=False)
In [99]:
start=time()
model.fit(train_pca,label)
print 'used {:.2f}s'.format(time()-start)
      Iter       Train Loss   Remaining Time 
         1       79940.9682            6.62m
         2       70830.7802            6.62m
         3       64173.7553            6.61m
         4       59037.7864            6.58m
         5       54599.3908            6.58m
         6       50886.2372            6.57m
         7       47761.6971            6.55m
         8       45040.9071            6.54m
         9       42543.2014            6.55m
        10       40319.8099            6.56m
        20       27069.1592            6.42m
        30       20786.5203            6.28m
        40       17051.2103            6.03m
        50       14576.1295            5.82m
        60       12778.5881            5.59m
        70       11447.6600            5.35m
        80       10375.5170            5.12m
        90        9518.4201            4.88m
       100        8816.3706            4.64m
       200        5027.3031            2.26m
       300        3355.2391            0.00s
used 405.63s
In [100]:
result=model.predict(test_pca)
In [ ]:
 
In [13]:
def save():
    import numpy as np
    submit=pd.DataFrame({'ImageId':np.arange(1,len(result)+1),'Label':result})
    submit.to_csv('gbc.csv',index=False)
In [14]:
# sub=pd.concat([pd.Series(np.arange(1,len(result)+1)),pd.Series(result)],axis=1)
# sub.columns=['ImageId','Label']
In [108]:
model.score(after,label)
Out[108]:
0.9878095238095238
In [115]:
tr=model.predict(after)
In [128]:
(tr==label).sum()/float(label.shape[0])
Out[128]:
0.9878095238095238
In [129]:
from sklearn.metrics import confusion_matrix
In [ ]:
 
In [4]:
from sklearn.svm import SVC
In [5]:
svc=SVC(verbose=1)
svc
Out[5]:
SVC(C=1.0, cache_size=200, class_weight=None, coef0=0.0,
  decision_function_shape=None, degree=3, gamma='auto', kernel='rbf',
  max_iter=-1, probability=False, random_state=None, shrinking=True,
  tol=0.001, verbose=1)
In [7]:
train_pca=train
test_pca=test
In [10]:
start=time()
svc.fit(train_pca,label)
print 'used {:.2f}s'.format(time()-start)
[LibSVM]used 4429.63s
In [19]:
result=svc.predict(test_pca)
In [21]:
save()
In [17]:
from sklearn import svm,datasets
from sklearn.model_selection import GridSearchCV
In [13]:
iris = datasets.load_iris()
iris.data[0:4]
Out[13]:
array([[ 5.1,  3.5,  1.4,  0.2],
       [ 4.9,  3. ,  1.4,  0.2],
       [ 4.7,  3.2,  1.3,  0.2],
       [ 4.6,  3.1,  1.5,  0.2]])
In [14]:
parameters = {'kernel':('linear', 'rbf'), 'C':[1, 5, 10]}
In [15]:
model = svm.SVC()
In [18]:
classifier =GridSearchCV(model, parameters)
In [19]:
classifier.fit(iris.data, iris.target)
Out[19]:
GridSearchCV(cv=None, error_score='raise',
       estimator=SVC(C=1.0, cache_size=200, class_weight=None, coef0=0.0,
  decision_function_shape=None, degree=3, gamma='auto', kernel='rbf',
  max_iter=-1, probability=False, random_state=None, shrinking=True,
  tol=0.001, verbose=False),
       fit_params={}, iid=True, n_jobs=1,
       param_grid={'kernel': ('linear', 'rbf'), 'C': [1, 5, 10]},
       pre_dispatch='2*n_jobs', refit=True, return_train_score=True,
       scoring=None, verbose=0)
In [20]:
classifier.best_params_
Out[20]:
{'C': 1, 'kernel': 'linear'}
In [37]:
# classifier.cv_results_
In [38]:
classifier.best_estimator_
Out[38]:
SVC(C=1, cache_size=200, class_weight=None, coef0=0.0,
  decision_function_shape=None, degree=3, gamma='auto', kernel='linear',
  max_iter=-1, probability=False, random_state=None, shrinking=True,
  tol=0.001, verbose=False)
In [24]:
import scipy
In [33]:
print scipy.stats.expon(scale=100)
<scipy.stats._distn_infrastructure.rv_frozen object at 0x0000000008E57E10>
In [ ]:
 
In [39]:
parameter_dist = {
  'C': scipy.stats.expon(scale=100),
  'kernel': ['linear'],
  'gamma': scipy.stats.expon(scale=.1),
}
In [119]:
classifier = grid_search.RandomizedSearchCV(model, parameter_dist)
classifier.fit(iris.data, iris.target)
Out[119]:
RandomizedSearchCV(cv=None, error_score='raise',
          estimator=SVC(C=1.0, cache_size=200, class_weight=None, coef0=0.0,
  decision_function_shape=None, degree=3, gamma='auto', kernel='rbf',
  max_iter=-1, probability=False, random_state=None, shrinking=True,
  tol=0.001, verbose=False),
          fit_params={}, iid=True, n_iter=10, n_jobs=1,
          param_distributions={'kernel': ['linear'], 'C': <scipy.stats._distn_infrastructure.rv_frozen object at 0x0000000008E79FD0>, 'gamma': <scipy.stats._distn_infrastructure.rv_frozen object at 0x0000000008E70080>},
          pre_dispatch='2*n_jobs', random_state=None, refit=True,
          scoring=None, verbose=0)
In [120]:
classifier.best_params_, classifier.best_score_
Out[120]:
({'C': 1.3991944739478859, 'gamma': 0.0022802232812657304, 'kernel': 'linear'},
 0.9933333333333333)
In [63]:
wtf=scipy.stats.expon(scale=10)
In [66]:
print wtf.rvs(5)
[ 10.29516445   1.53962143   2.67578885   0.21101641   1.31133069]
In [ ]:
wtf.rvs
In [ ]: